Abstract
Purpose: T1 mapping is a widely used quantitative MRI technique, but its tissue-specific values remain inconsistent across protocols, sites, and vendors. The ISMRM Reproducible Research study group (RRSG) and Quantitative MR study group (qMRSG) jointly launched a T1 mapping reproducibility challenge. The goal was to investigate whether an independently-implemented image acquisition protocol at multiple centers could reliably measure T1 using inversion recovery in a standardized phantom and in brains of healthy volunteers.
Methods: The reproducibility of a robust T1 mapping protocol and fitting algorithm from a well-known Magnetic Resonance in Medicine publication (Barral et al. 2010) were evaluated. Participants in the challenge were invited to acquire T1 mapping data on a standard ISMRM/NIST phantom and/or in healthy human brains. Data submission, pipeline development, and analysis were performed using open-source platforms for increased reproducibility and transparency. For participants acquiring data at multiple sites, inter-submission and intra-submission comparisons were conducted by selecting one dataset per submission.
Results: Eighteen submissions were accepted using data collected from MRIs from three manufacturers (Siemens, GE, Philips) and at 3T (except one submission, at 0.35T), resulting in a total of 38 datasets acquired in phantoms and 56 datasets in healthy human subjects. Inter-submission mean coefficient of variation (CoV) was 6.1% for phantom measurements, nearly twice as high as the evaluated intra-submission CoV (2.9%). A similar trend was observed in the human data (inter-/intra- submission CoV was 6.0/2.9 % in the genu and 16/6.9 % in the cortical gray matter).
Conclusion: The imaging protocol and fitting algorithm from Barral et al. (2010) resulted in good reproducibility of both phantom and human brain T1 measurements. Differences in implementations between submissions resulted in higher variance in reported values relative to intra-submission variability. This challenge generated a large open database of inversion recovery T1 mapping acquisitions across several sites and MRI vendors accessible at osf.io/ywc9g/. To allow for the wider community to access and engage with this dataset, we developed an interactive dashboard that is available at https://
Dashboard: Challenge Submissions
+++
1| introduction
Significant challenges exist in the reproducibility of quantitative MRI (qMRI) Keenan et al., 2019. Despite its promise of improving the specificity and reproducibility of MRI acquisitions, few qMRI techniques have been integrated into clinical practice. Even the most fundamental MR parameters cannot be measured with sufficient reproducibility and precision across clinical scanners to pass the second of six stages of technical assessment for clinical biomarkers Fryback & Thornbury, 1991Schweitzer, 2016Seiberlich et al., 2020. Half a century has passed since the first quantitative T1 (spin-lattice relaxation time) measurements were first reported as a potential biomarker for tumors Damadian, 1971, followed shortly thereafter by the first in vivo quantitative T1 maps Pykett & Mansfield, 1978 of tumors, but there is still disagreement in reported values for this fundamental parameter across different sites, vendors, and implementations Stikov et al., 2015.
Among fundamental MRI parameters, T1 holds significant importance Boudreau et al., 2020. It represents the time it takes for the longitudinal magnetization to recover after being disturbed by an RF pulse. The T1 value varies based on molecular mobility and magnetic field strength Bottomley et al., 1984Dieringer et al., 2014Wansapura et al., 1999, making it a valuable parameter for distinguishing different tissue types. Accurate knowledge of T1 values is essential for optimizing clinical MRI pulse sequences for contrast and time efficiency Ernst & Anderson, 1966Redpath & Smith, 1994Tofts, 1997 and as a calibration parameter for other quantitative MRI techniques Sled & Pike, 2001Yuan et al., 2012. Among the number of techniques to measure T1, inversion recovery (IR) Drain, 1949Hahn, 1949 is widely held as the gold standard technique, as it is robust against other effects (e.g. B1 inhomogeneity) and potential errors in measurements (e.g. insufficient spoiling) Stikov et al., 2015. However, because the technique requires a long repetition time (TR > T1), it is very slow and impractical for whole-organ measurements, limiting its clinical use. In practice, it is mostly used as a reference to validate other T1 mapping techniques, such as variable flip angle imaging (VFA) Cheng & Wright, 2006Deoni et al., 2003Fram et al., 1987, Look-Locker Look & Locker, 1970Messroghli et al., 2004Piechnik et al., 2010, and MP2RAGE Marques et al., 2010Marques & Gruetter, 2013.
Efforts have been made to develop quantitative MRI phantoms to assist in standardizing T1 mapping methods Keenan et al., 2018. A quantitative MRI standard system phantom was created in a joint project between the International Society for Magnetic Resonance in Medicine (ISMRM) and the National Institute of Standards and Technology (NIST) Stupic et al., 2021, and has since been commercialized (Premium System Phantom, CaliberMRI, Boulder, Colorado). The spherical phantom has a 57-element fiducial array containing spheres with doped liquids that model a wide range of T1, T2, and PD values. The reference values of each sphere were measured using NMR at 3T Stupic et al., 2021. The standardized concentration for relaxometry values established as references by NIST are also used by another company for their relaxometry MRI phantoms (Gold Standard Phantoms Ltd., Rochester, England). The cardiac TIMES phantom Captur et al., 2016 is another commercially available system phantom focusing on T1 and T2 values in blood and heart muscles, pre- and post-contrast. The ISMRM/NIST phantom has been used in several large multicenter studies already, for example in Bane et al., 2018 where they compared measurements at eight sites on a single ISMRM/NIST phantom using the inversion recovery and VFA T1 mapping protocols recommended by NIST, as well as some site-specific imaging protocols used for dynamic contrast enhanced (DCE) imaging. Bane et al. (2018) concluded that the acquisition protocol, field strength, and T1 value of the sample impacted the level of accuracy, repeatability, and interplatform reproducibility that was observed. In another study led by NIST researchers Keenan et al., 2021, T1 measurements were done at two clinical field strengths (1.5T and 3.0 T) and 27 MRI systems (three vendors) using the recommended NIST protocols. That study, which only investigated phantoms, found no significant relationship between T1 discrepancies of the measurements and the MRI vendors used.
The 2020 ISMRM reproducibility challenge [1] posed the following question:
Will an imaging protocol independently-implemented at multiple centers reliably measure what is considered one of the fundamental MR parameters (T1) using the most robust technique (inversion recovery) in a standardized phantom (ISMRM/NIST system phantom) and in the healthy human brain?
More broadly, this challenge aimed at assessing the reproducibility of a qMRI method presented in a seminal paper, Barral et al., 2010, by evaluating the variability in measurements observed by different research groups that implemented this imaging protocol. As the focus of this challenge was on reproducibility, the challenge design emphasized the use of reproducible research practices, such as sharing code, pipelines, data, and scripts to reproduce figures.
2| methods
2.1| Phantom and human data
The phantom portion of the challenge was launched for those with access to the ISMRM/NIST system phantom Stupic et al., 2021 (Premium System Phantom, CaliberMRI, Boulder, Colorado). Two versions of the phantom have been produced with slightly different T1/T2/PD values in the liquid spheres, and both versions were used in this study. Phantoms with serial numbers 0042 or less are referred to as “Version 1”, and those with 0043 or greater are “Version 2”. The phantom has three plates containing sets of 14 spheres for ranges of proton density (PD), T1 (NiCl2), and T2 (MnCl2) values. Reference T1 values at 20 °C and 3T for the T1 plate are listed in Table 1 for both versions of the phantom. Researchers that participated in the challenge were instructed to record the temperature before and after scanning the phantom using the phantom’s internal thermometer. Instructions for positioning and setting up the phantom were devised by NIST after they had designed the phantom (prior to the challenge), and were provided to participants through the NIST website [2]. In brief, instructions included details about how to orient the phantom consistently at different sites, and how long the phantom should be in the scanner room prior to scanning so that a thermal equilibrium was achieved prior to scanning.
Table 1:Reference T1 values [3] of the NiCl2 array of the standard system phantom (for both phantom versions) measured at 20 °C and 3T. Phantoms with serial numbers 0042 or less are referred to as “Version 1”, and those 0043 or greater are “Version 2”.
Sphere | Version 1 (ms) | Version 2 (ms) |
|---|---|---|
1 | 1989 ± 1.0 | 1883.97 ± 30.32 |
2 | 1454 ± 2.5 | 1330.16 ± 20.41 |
3 | 984.1 ± 0.33 | 987.27 ± 14.22 |
4 | 706 ± 1.0 | 690.08 ± 10.12 |
5 | 496.7 ± 0.41 | 484.97 ± 7.06 |
6 | 351.5 ± 0.91 | 341.58 ± 4.97 |
7 | 247.13 ± 0.086 | 240.86 ± 3.51 |
8 | 175.3 ± 0.11 | 174.95 ± 2.48 |
9 | 125.9 ± 0.33 | 121.08 ± 1.75 |
10 | 89.0 ± 0.17 | 85.75 ± 1.24 |
11 | 62.7 ± 0.13 | 60.21 ± 0.87 |
12 | 44.53 ± 0.090 | 42.89 ± 0.44 |
13 | 30.84 ± 0.016 | 30.40 ± 0.62 |
14 | 21.719 ± 0.005 | 21.44 ± 0.31 |
Participants were also instructed to collect T1 maps in the brains of healthy human participants, if possible. To ensure consistency across datasets, single-slice positioning parallel to the anterior commissure - posterior commissure (AC-PC) line was recommended. Before the scanning process, the participants granted their consent [4] to share their de-identified data openly with the challenge organizers and on the website Open Science Framework (OSF.io). As the submitted single-slice inversion recovery images would be along the AC-PC line, they are unlikely to contain sufficient information for facial identification, and therefore participants were not instructed to de-face their data. The researchers who submitted human data for the challenge provided written confirmation to the organizers that their data was acquired in accordance with their institutional ethics committee (or equivalent regulatory body) and that the subjects had consented to sharing their data as described in the challenge.
2.2| Protocol
Participants were instructed to acquire the T1 mapping data using the spin-echo inversion recovery protocol for T1 mapping as reported in Barral et al., 2010, and detailed in Table 2. This protocol uses four inversion times optimized for human brain T1 values and uses a relatively short TR (2550 ms). It is important to note that this acquisition protocol is not suitable for T1 fitting models that assume TR > 5T1. Instead, more general models of inversion recovery, such as the Barral et al. (2010) fitting model described in Section 2.4.1, can be used to fit this data.
Table 2:Imaging protocol for inversion recovery T1 mapping proposed to the participants for the 2020 joint RRSG-qMRSG reproducibility challenge. The protocol is the brain imaging protocol used in Barral et al. (2010), and which is meant for the T1 values observed in healthy human brains.
Pulse sequence | Spin-echo inversion recovery |
|---|---|
Repetition Time (TR) | 2550ms |
Inversion Time (TI) | 50, 400, 1100, 2500 ms |
Echo Time (TE) | 14 ms |
In-plane resolution | 1x1 mm2 |
Slice thickness | 2mm |
Researchers who participated in the challenge were advised to adhere to this protocol as closely as possible, and to report any differences in protocol parameters due to technical limitations of their scanners and/or software. It was recommended that participants submit complex data (magnitude and phase, or real and imaginary), but magnitude-only data was also accepted if complex data could not be conveniently exported.
2.3| Data Submissions
Data submissions for the challenge were managed through a dedicated repository on GitHub, accessible at https://*.yaml) configuration file containing submission, dataset, and acquisition details (such as data type, submitter name and email, site details, phantom or volunteer details, and imaging protocol details) was required for each submitted dataset to ensure that the information was standardized and easily found. Each submission was reviewed to confirm that guidelines were followed, and then datasets and configuration files were uploaded to OSF.io (osf.io/ywc9g). A Jupyter Notebook Beg et al., 2021Kluyver et al., 2016 pipeline was used to generate T1 maps using qMRLab Cabana et al., 2015Karakuzu et al., 2020 and quality-check the datasets prior to accepting the submissions; in particular, we assured that the NiCL2 array was imaged, that the DICOM images were correctly converted to NIfTI, the each images for each acquired TI were not renormalized (in particular, Philips platforms have different image export options that changes how the images are scaled, and a reconversion was necessary to ensure proper scaling for quantitative imaging in some cases – see the submissions GitHub issue #5 for one example [5]) for the purposes of quality assurance. Links to the Jupyter Notebook for reproducing the T1 map were shared using the MyBinder platform in each respective submission GitHub issue, ensuring that computational environments (eg, software dependencies and packages) could be reproduced to re-run the pipeline in a web browser.
2.4| Data Processing
2.4.1| Fitting Model and Pipeline
A reduced-dimension non-linear least squares (RD-NLS) approach was used to fit the complex general inversion recovery signal equation:
where a and b are complex constants. This approach, introduced in , models the general T1 signal equation without the long-TR approximation. The a and b constants inherently factor TR in them, as well as other imaging parameters (eg, excitation and refocusing flip angles, TE, etc). Barral et al. (2010) shared the implementation of the fitting algorithm used in their paper [6]. Magnitude-only data were fitted to a modified-version of [1] (Eq. 15 of Barral et al. (2010)) with signal-polarity restoration. To facilitate its use in our pipelines, a wrapper was implemented around this code available in the open-source software qMRLab Cabana et al., 2015Karakuzu et al., 2020, which provides a commandline interface (CLI) to call the fitting in MATLAB/Octave scripts.
A Jupyter Notebook data processing pipeline was written using MATLAB/Octave. This pipeline automatically downloads all the datasets from the data-hosting platform osf.io (osf.io/ywc9g), loads each dataset configuration file, fits the T1 data voxel-wise, and exports the resulting T1 map to the NIfTI and PNG formats. This pipeline is available in a GitHub repository (https://RRSG_T1_fitting.ipynb). Once all submissions were collected and the pipeline was executed, the T1 maps were uploaded to OSF (osf.io/ywc9g).
2.4.2| Image Labeling & Registration
A schematic of the phantom is shown in Figure 1-a. The T1 plate (NiCl2 array) of the phantom has 14 spheres that were labeled as the regions-of-interest (ROI) using a numerical mask template created in MATLAB, provided by NIST researchers (Figure 1-b). To avoid potential edge effects in the T1 maps, the ROI labels were reduced to 60% of the expected sphere diameter. A registration pipeline in Python using the Advanced Normalization Tools (ANTs) Avants et al. (2009) was developed and shared in the analysis repository of our GitHub organization (https://register_t1maps_nist.py, commit ID: 8d38644). Briefly, a label-based registration was first applied to obtain a coarse alignment, followed by an affine registration (gradientStep: 0.1, metric: cross correlation, number of steps: 3, iterations: 100/100/100, smoothness: 0/0/0, sub-sampling: 4/2/1) and a BSplineSyN registration (gradientStep:0.5, meshSizeAtBaseLevel:3, number of steps: 3, iterations: 50/50/10, smoothness: 0/0/0, sub-sampling: 4/2/1). The ROI labels template was nonlinearly registered to each T1 map uploaded to OSF.
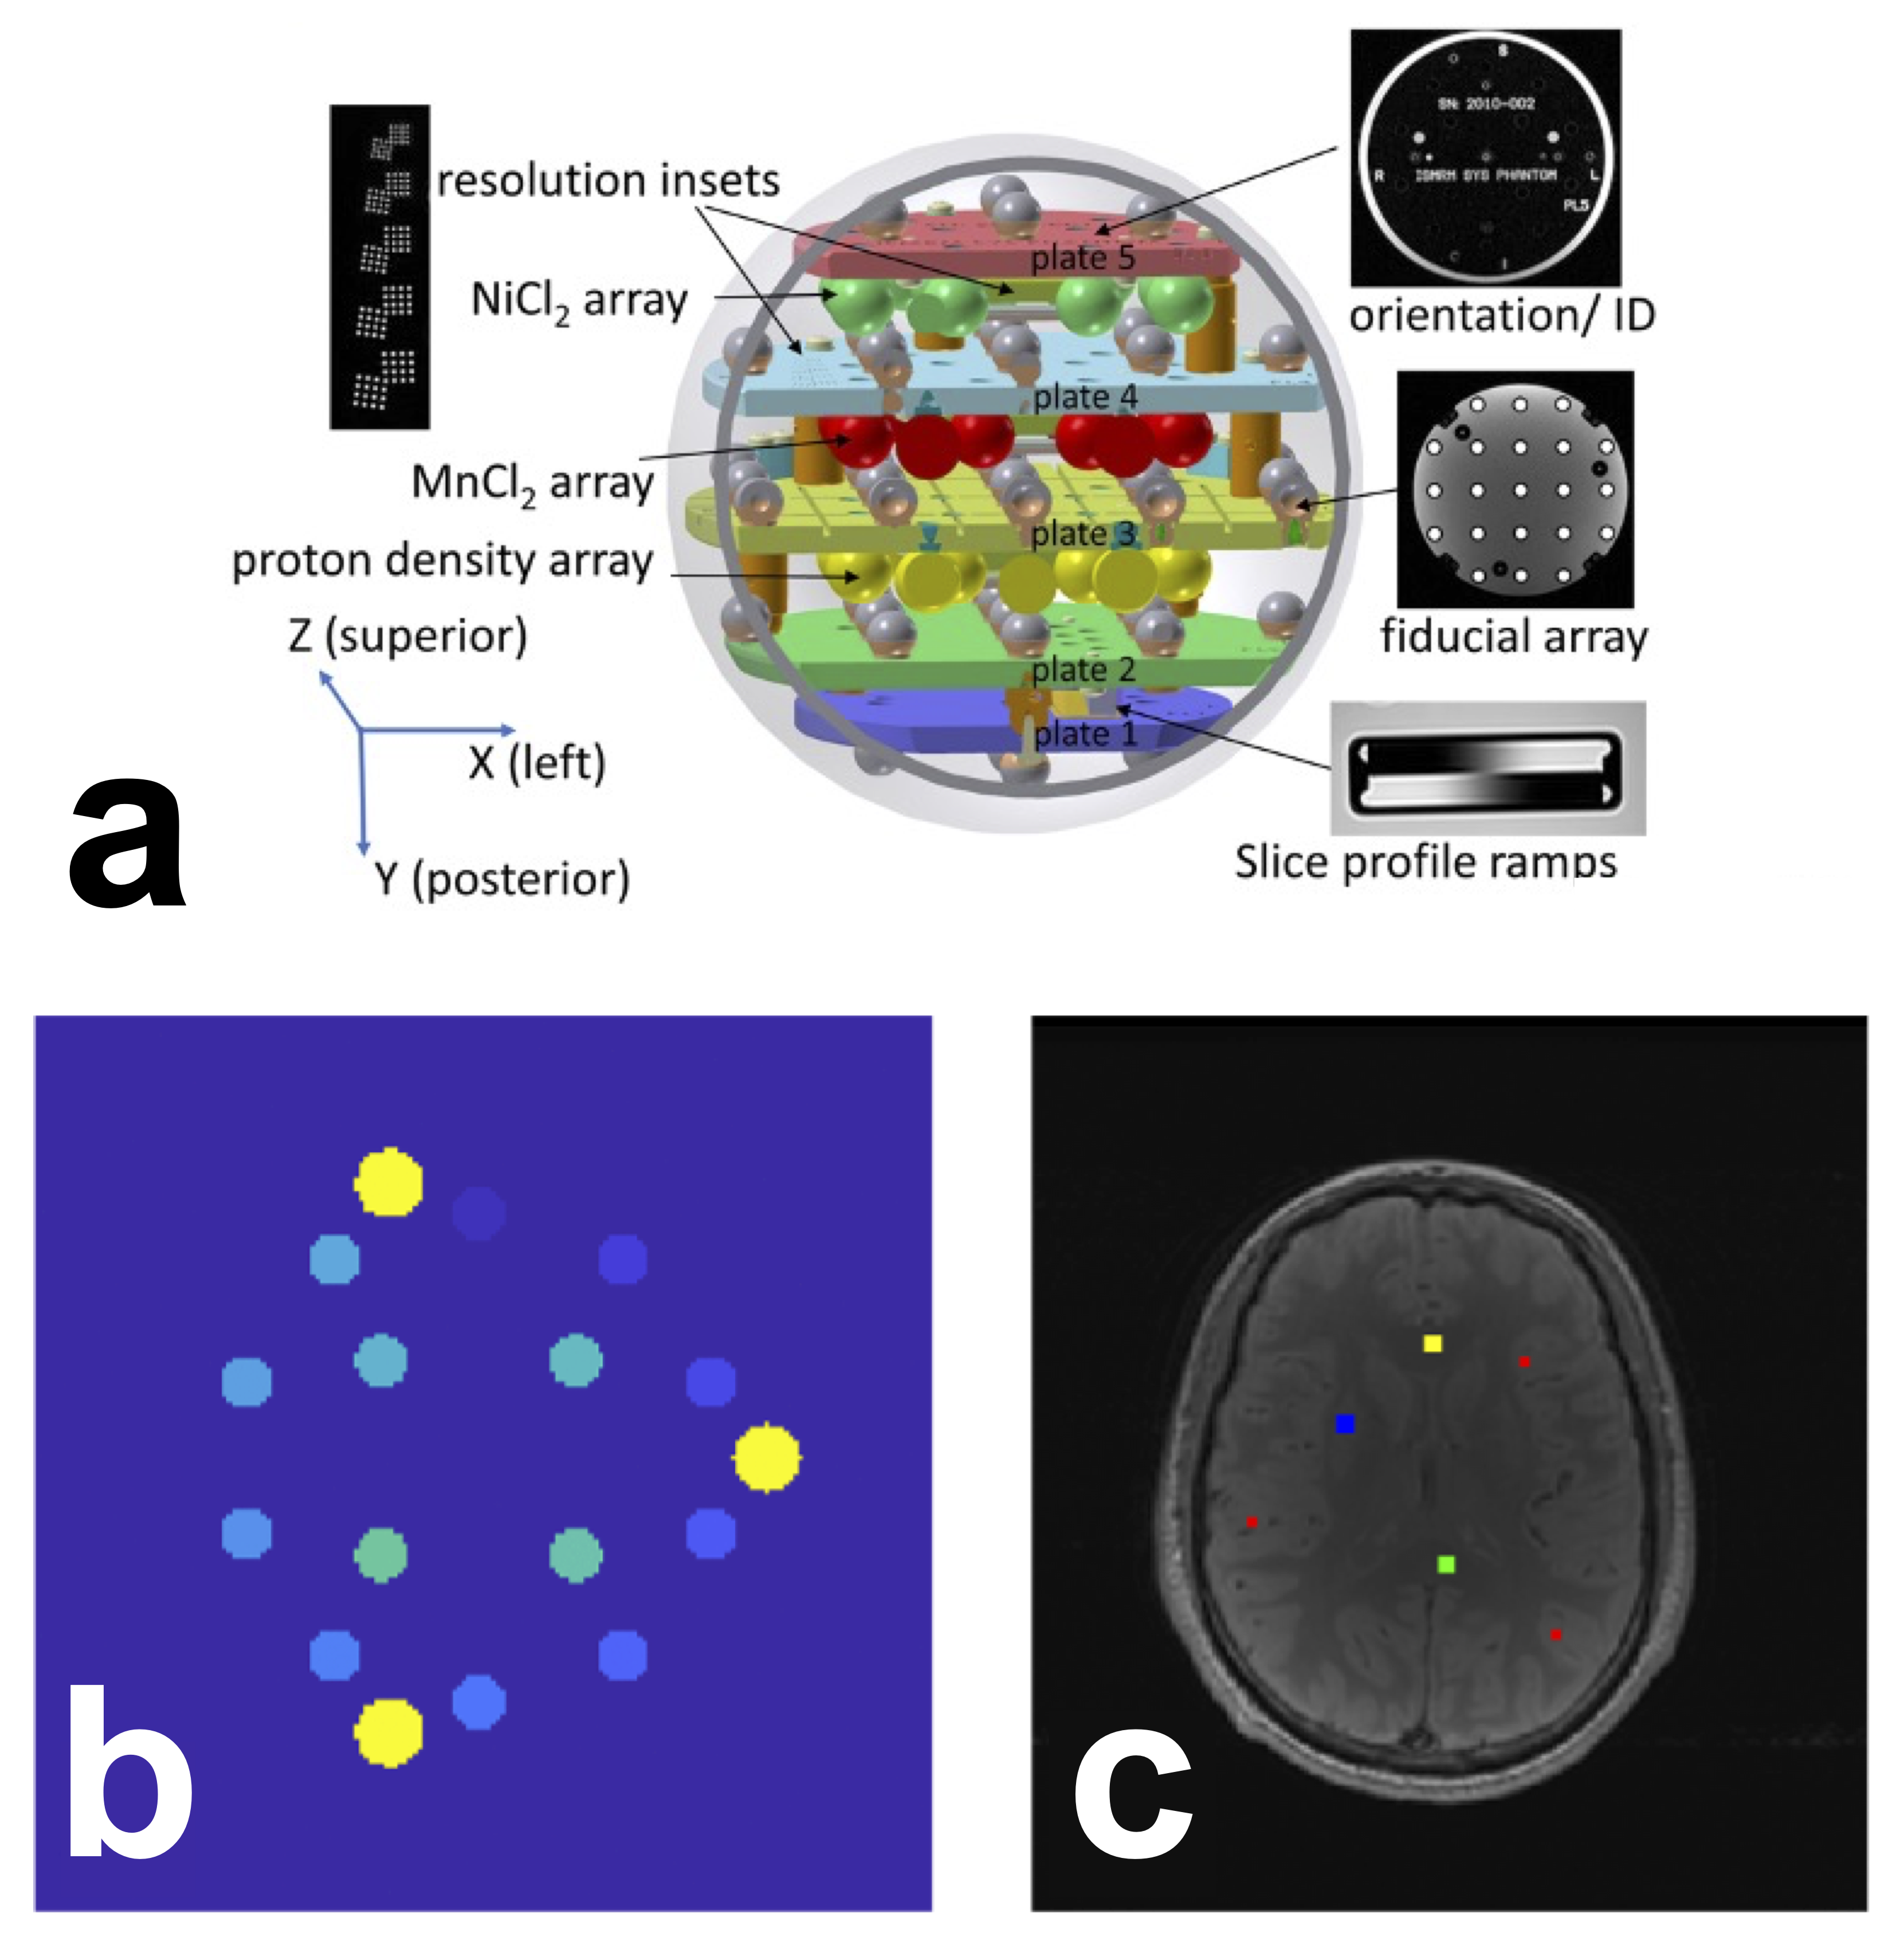
Figure 1 Schematic of the system phantom (a) used in this challenge. Reproduced and cropped from Stupic et al. 2021 (Stupic et al. 2021) (Creative Commons CC BY license). ROI selection for the ISMRM/NIST phantom (b) and the human brain (c). b) The 14 phantom ROIs (shades of blue/green) were automatically generated using a script provided by NIST. In yellow are the three reference pins in the phantom, i.e. these are not ROIs or spheres. c) Human brain ROIs were manually segmented in four regions: the genu (yellow, 5⨯5 voxels), splenium (green, 5⨯5 voxels), deep gray matter (blue, 5⨯5 voxels), and cortical gray matter (red, three sets of 3⨯3 voxels). Note: due to differences in slice positioning from the single-slice datasets provided by certain sites, for some datasets it was not possible to manually segment an ROI in the genu or deep gray matter. In the case of the missing genu, left or right frontal white matter (WM) was selected; for deep gray matter (GM), it was omitted entirely for those cases.
Manual ROIs were segmented by a single researcher (M.B., 11+ years of neuroimaging experience) using FSLeyes McCarthy, 2022 in four regions for the human datasets Figure 1-c): located in the genu, splenium, deep gray matter, and cortical gray matter. Automatic segmentation was not used because the data were single-slice and there was inconsistent slice positioning between datasets.
2.4.3| Analysis and Statistics
Analysis code and scripts were developed and shared in a version-tracked public GitHub repository [7]. T1 fitting and main data analysis was performed for all datasets by one of the challenge organizers (M.B.). Python-based Jupyter Notebooks were used for both the quality assurance and main analysis workflows. The computational environment requirements were containerized in Docker Boettiger, 2015Merkel, 2014, allowing for an executable environment that can reproduce the analysis in a web browser through MyBinder [8] Project Jupyter et al., 2018. Python scripts handled reference data, database handling, ROI masking, and general analysis tools, while configuration files managed the dataset information which were downloaded and pooled using a script (make_pooled_datasets.py). The databases were created using a reproducible Jupyter Notebook and subsequently saved in the repository.
For the ISMRM/NIST phantom data, mean T1 values for each ROI were compared with temperature-corrected reference values and visualized in three different types of plots (linear axes, log-log axes, and error relative to the reference value). This comparison was repeated for individual measurements at each site and for all measurements grouped together. Temperature correction was carried out via nonlinear interpolation [9] of the set of reference NIST T1 values between 16 °C and 26 °C (2 °C intervals), listed in the phantom technical specifications. For the human datasets, a notebook was created to plot the mean and standard deviations for each tissue ROI from all submissions from all sites. All quality assurance and analysis plot images were saved to the repository for ease-of-access and a timestamped version-controlled record of the state of the analysis figures. The database files of ROI values and acquisition details for all submissions were also saved to the repository.
An interactive dashboard [10] was developed in Dash by Plotly (Plotly Technologies Inc. 2015) and hosted by NeuroLibre Karakuzu et al., 2022 to enable real-time exploration of the data, analysis, and statistics of the challenge results. The dashboard reports descriptive statistics for a variety of alternative looks at phantom and brain data, as well as some statistical comparisons (e.g., the hierarchical shift function [11]). The data was collected from the pre-prepared databases of masked ROI values and incorporated other database information, such as phantom version, temperature, MRI system, and reference values. The interactive dashboard displays these results for all measurements at all sites.
3| results
3.1| Dashboard
To disseminate the challenge results, a web-based dashboard was developed (Figure 2, https://
Returning to the home page and selecting the brain section allows exploration of information on the brain datasets (Figure 2-c, left), such as mean T1 and STD for different ROI regions, as well as selection of specific MRI manufacturers. Choosing the “By Regions” tab provides whisker plots of the datasets for the selected ROI (Figure 2-c, right), similar to the plots for the phantom.
Figure 2 Dashboard. a) welcome page listing all the sites, the types of subject, and scanner, and the relationship between the three. Row b) shows two of the phantom dashboard tabs, and row c) shows two of the human data dashboard tabs Link: https://
3.2| Submissions
Eighteen submissions were included in the analysis, which resulted in 38 T1 maps of the NIST/system phantom, and 56 brain T1 maps. Figure 3 illustrates all the submissions that acquired phantom data (Figure 3-a) and human data (Figure 3-b), the number of scanners used for each submission, and the number of T1 mapping datasets. It should be noted that these numbers include a subset of measurements where both complex and magnitude-only data from the same acquisition were used to fit T1 maps, thus the total number of unique acquisitions is lower than the numbers reported above (27 for phantom data and 44 for human data). The datasets were collected on three MRI manufacturers (Siemens, GE, Philips) and were acquired at 3T [12], except for one dataset acquired at 0.35T (the ViewRay MRidian MR-linac) . To showcase the heterogeneity of the actual T1 map data from the independently-implemented submissions, Figure 4 displays six T1 maps of the phantoms submitted to the challenge.
Figure 2:Complete list of the datasets submitted to the challenge. Submissions that included phantom data are shown in a), and those that included human brain data are shown in b). Submissions were assigned numbers to keep track of which submissions included both phantom and human data. Some submissions included datasets acquired on multiple scanners. For the phantom (panel a), each submission acquired all their data using a single phantom, however some researchers shared the same physical phantom with each other (same color). Some additional details about the datasets are included in the T1 maps column, if relevant. Note that for complex datasets in the magnitude/phase format, T1 maps were calculated both using magnitude-only data and complex-data, but these were from the same measurement (branching off arrow).
Of these datasets, several submissions went beyond the minimum acquisition and acquired additional datasets using the ISMRM/NIST phantom, such as a traveling phantom (7 scanners/sites), scan-rescan, same-day rescans on two MRIs, short TR vs long TR, and 4 point TI vs 14 point TI. For humans, one site acquired 13 subjects on two scanners (different manufacturers), one site acquired 6 subjects, and one site acquired a subject using two different head coils (20 channels vs. 64 channels).
Figure 3:Example T1 maps that were generated from submitted data. Note the differences in acquisitions (e.g. FOV (top middle), orientation (bottom right, gradient distortion correction (top left and right) and resulting artifacts in the T1 maps (e.g. ghosting (bottom left), ringing (bottom middle), noise profiles (top left and bottom right), deformation/slice mispositioning (top right)) resulting from the independently-implemented acquisition protocols.
3.3| Phantom
An overview of the T1 results for the submitted ISMRM/NIST phantom datasets is displayed in Figure 5. The same data is presented in each column with different axes types (linear, log, and error) to better visualize the results. Figure 5-a shows good agreement (slope = 0.98, intercept = -14 ms) for this dataset in comparison to the reference T1 values. However, this trend did not persist for low T1 values (T1 smaller than 100-200 ms), as seen in the log-log plot (Figure 5-b), which was expected because the imaging protocol is optimized for human water-based T1 values (T1 higher than 500 ms). Errors exceeding 10% are observed for T1 values of phantom spheres below this threshold (Figure 5-c). These trends are observed for the entire-dataset plots as well (Figure 5 d-f). More variability is seen in Figure 5-d around the identity diagonal at very high T1 (T1 ~ 2000 ms) than towards the WM-GM values (T1 ~ 600-1400 ms), which is less apparent in the log-log plot (Figure 5-e). In addition to the low T1 values exceeding the 10% error threshold (Figure 5-f), a few measurements with outlier values exceeding 10% error (~3-4) were observed in the human water-based tissue range (~500-2000 ms).
Figure 4:Measured mean T1 values vs. temperature-corrected NIST reference values of the phantom spheres presented as linear plots (a,d), log-log plots (b,e), and plots of the error relative to reference T1 value. Plots (a–c) are of an example single dataset (T1 map dataset 6-1-1 in Figure 3-a), whereas plots (d–f) are of all acquired datasets. The dashed lines in plots (c,f) represent a ±10 % error.
Inter-submission coefficients of variation (CoV) were calculated by selecting ad hoc one single T1 map submitted per challenge participant [13] and calculating the CoV of the T1 means per sphere. The average inter-submission CoV across the first five spheres representing the expected T1 value range in the human brain (~ 500 to ~ 2000 ms) was 6.1 % (sphere 1 = 4.7 %, sphere 2 = 3.1 %, sphere 3 = 6.3 %, sphere 4 = 12.8 %, sphere 5 = 7.3 %). Two sites were clear outliers that had particular issues for sphere 4, likely because the signal null for this particular T1 value (~600 ms) is near the second TI and these outliers incorrectly flip the signal at the near-null TI during magnitude-only data fitting [14]; by removing these outliers, the mean inter-submission CoV reduces to 4.1 % (sphere 1 = 5.4 %, sphere 2 = 3. 5%, sphere 3 = 2.5 %, sphere 4 = 4.2 %, sphere 5 = 4.9 %). One participant measured T1 maps with one phantom using one implemented protocol (identical imaging parameters) at 7 different sites on systems from a single manufacturer at 3T, and so a mean intra-submission CoV across the first five spheres for this case was calculated to be 2.9 % (sphere 1 = 4.9 %, sphere 2 = 3.5 %, sphere 3 = 2.6 %, sphere 4 = 2.0 %, sphere 5 = 1.6 %).
Figure 5:Scatter plot comparing complex and magnitude-only fitted data across the first five spheres representing the expected T1 value range in the human brain (~500 to ~2000 ms). The markers are color-coded based on the implementation site, while their size represents the percent difference calculated between the two fitting methods (magnitude or complex) for that datapoint.
Figure 6 compares the mean T1 values measured using complex and magnitude-only data for the 11 datasets where authors provided both in their submissions. Note that these datasets are from the same acquisition, not two unique acquisitions. The scatter plot shows that for the range of T1 values expected in the brain (T1 > 500 ms), there is almost no difference in fitted T1 values between the two types of data (the highest outlier indicates ~9 ms difference). However, for T1 values less than ~250 ms large errors [15] were present, likely due to the data acquisition imaging protocol (specifically, TI range) being sub-optimal for this range of T1 values.
Figure 6:Hierarchical analysis of T1 estimation error across voxel-wise distributions in spheres 1-6, using 20 measurements split into 9 quantiles (q1-q9). Each panel shows individual shift functions for each measurement (colored by vendor) in the top row, which characterize the percent measurement error as either overestimation or underestimation. The bottom row in each panel (black markers) displays the average trend of bootstrapped differences at each decile in milliseconds. The trends highlight any notable common patterns at the respective decile, such as a 39 ms median underestimation trend in Sphere 3. Straight lines in the top row indicate a homogeneous measurement error across voxels. High-density intervals not intersecting the zero crossing indicate a significant trend at the respective decile.
3.4| Human
Figure 8 summarizes the results from human datasets submitted to this challenge, showing mean and standard deviation T1 values from the WM (genu) and GM (cerebral cortex) ROIs. The top plot collapses all datasets for each site, while the bottom plot shows each dataset separately. Mean WM T1 values across all submissions was 828 ± 38 ms in the genu and 854 ± 50 ms in the splenium, and mean GM T1 values were 1548 ± 156 ms in the cortex and 1188 ± 133 ms in the deep GM, with less variations overall in WM compared to GM, possibly due to better ROI placement and less partial voluming in WM. Inter-submission coefficients of variation (CoV) for independently-implemented imaging protocols were calculated using one T1 map measurement per submission that most closely matched the proposed protocol, and were 6.0% for genu, 11% for splenium, 16% for cortical GM and 22% for deep GM. One site (site 9) measured multiple subjects on three scanners using two different vendors, and so intra-submission CoVs for these centrally-implemented protocols were calculated over acquired T1 maps from this site, and were 2.9% for genu, 3.5% for splenium, 6.9 % for cortical GM and 7.8% for deep GM. This particular acquisition had an ideal slice positioning, cutting through the AC-PC line and the genu for proper ROI placement, particularly for the corpus callosum and deep GM (Supplementary Figure 1 - top left).
3.5| discussion
3.6| Achievements of the challenge
The challenge focused on exploring the reproducibility of the gold standard inversion recovery T1 mapping method reported in a seminal paper Barral et al., 2010. Eighteen submissions independently implemented the inversion recovery T1 mapping acquisition protocol as outlined in Barral et al. (2010)(which is optimized for the T1 values observed in brain tissue), and reported T1 mapping data in a standard quantitative MRI phantom and/or human brains at 27 MRI sites, using systems from three different vendors (GE, Philips, Siemens). The collaborative effort produced an open-source database of 94 T1 mapping datasets, including 38 ISMRM/NIST phantom and 56 human brain datasets. A standardized T1 processing pipeline was developed for different dataset types, including magnitude-only and complex data. Additionally, Jupyter notebooks that can be executed in containerized environments were developed for quality assurance, visualization, and analyses. An interactive web-based dashboard was also developed to allow for easy exploration of the challenge results in a web-browser.
To evaluate the accuracy of the resulting T1 values, the challenge used the standard ISMRM/NIST phantom with fiducial spheres having T1 values in the range of human brain tissue, from 500 to 2000 ms (see Figure 5). As anticipated for this protocol, there was a decrease in the accuracy in measurements for spheres with T1 below 300 ms. Overall, the majority of the independently implemented imaging protocols from various sites are consistent with the temperature-corrected reference values, with only a few exceptions. Using the NIST phantom, we report that sites that independently implemented the imaging protocol resulted in an inter-submission mean CoV (6.1 %) that was twice as high as the intra-submission mean CoV measured at seven sites (2.9 %). A similar trend was observed in vivo. Inter-submission CoV for WM (genu) was 6.0 % and for GM (cortex) was 16.5 % vs the intra-submission CoV that was 2.9 % and 6.9%, with generally higher CoVs relative to the phantom measurements likely due to biological variability Piechnik et al., 2013Stanisz et al., 2005.
3.7| Comparison with other studies
The work done during this challenge involved a multi-center quantitative T1 mapping study using the NIST phantom across various sites. This work overlaps with two recent studies Bane et al., 2018Keenan et al., 2021. Bane et al. (2018) focused on the reproducibility of two standard quantitative T1 techniques (inversion recovery and variable flip angle) and a wide variety of site-specific T1 mapping protocols for DCE, mostly VFA protocols with fewer flip angles, which were implemented at eight imaging centers covering the same 3 MRI vendors featured in this challenge (GE/Philips/Siemens). The inter-platform coefficient of variation for the standard inversion recovery T1 protocol was 5.46% at 3 T in Bane et al., 2018, which was substantially lower than what they observed for their standard VFA protocol (22.87%). However, Bane et al.’s work differed from the challenge in several ways. First, the standard imaging protocol for inversion recovery used by Bane et al. (2018) had more inversion times (14 compared to the challenge’s 4) to cover the entire range of T1 values of the phantom. Secondly, Bane et al. (2018) used a single traveling phantom for all sites, whereas the challenge used a total of 8 different phantoms (some were shared amongst people who participated independently). Thirdly, Bane et al. (2018) averaged the signals within each ROI of each sphere prior to fitting for the T1 values, whereas the challenge pipeline fits the T1 values on a per-voxel basis and only subsequently calculates the mean/median/std. They also only acquired magnitude data, in contrast to the challenge where participants were encouraged to submit both complex and magnitude-only data. Lastly, in Bane et al. (2018), the implementations of the common inversion recovery protocols were fully standardized (full protocol) across all the platforms (except for two cases where one manufacturer couldn’t achieve the lowest TI) and imposed and coordinated by the principal researchers. In contrast, the challenge sought to explore the variations that would occur for a less-restricted protocol (Table 2) that is independently-implemented at multiple centers, which more closely emulates the quantitative MR research flow (publication of a technique and protocol → independently implement the pulse sequence and/or protocol → use the new implementation independently in a study → publish). Of note, in the challenge, one participating group coordinated a large multicenter dataset that mirrors the study by Bane et al. (2018) by imaging a single phantom across 7 different imaging sites, albeit doing so on a single manufacturer. Using this subset, the mean cross-site CoV was 2.9 % (range: 1.6 - 4.9 %) for the first five spheres, which is in agreement with the range of observations for all spheres by Bane et al. (Bane et al. 2018) at 3T using their full inversion recovery protocol (CoV = 5.46 %; range: 0.99 - 14.6 %).
Another study by Bane et al. (2018)Keenan et al. (2021) also investigated the accuracy of T1 mapping techniques using a single ISMRM/NIST system phantom at multiple sites and on multiple platforms. Like Bane et al. (2018) they used an inversion recovery imaging protocol optimized for the full range of T1 values represented in the ISMRM/NIST phantom, which consisted of 9 to 10 inversion times and a TR of 4500 ms (TR ~ 5T1 of WM at 3T). They reported no consistent pattern of differences in measured inversion recovery T1 values across MRI vendors for the two T1 mapping techniques they used (inversion recovery and VFA). They observed relative errors between their T1 measurements and the reference values of the phantom to be below 10% for all T1 values and the larger errors were observed at the lowest and highest T1 values of the phantom.
3.8| Lessons Learned and Future Directions
There are some important things to note about this challenge. Firstly, the submissions for this challenge were due in March 2020, which was impacted by the COVID-19 pandemic lockdowns, thereby reducing repeated experiments due to access limitations. Nevertheless, a substantial number of participants submitted their datasets. Some groups intended on acquiring more data, and others intended on re-scanning volunteers, but could no longer do so due to local pandemic restrictions.
This reproducibility challenge aimed to compare differences between independently-implemented protocols. Crowning a winner was not an aim of this challenge, due to concerns that participants would have changed their protocols to get closer to the reference T1 values, leading to a broader difference in protocol implementations across MRI sites. Instead, we focused on building consensus by creating an open data repository, sharing reproducible workflows, and presenting the results through interactive visualizations. Future work warrants the study of inter-site differences in a vendor-neutral workflow Karakuzu et al., 2022 by adhering to the latest Brain Imaging Data Structure (BIDS) community data standard on qMRI Karakuzu et al., 2022.
4| conclusion
The 2020 Reproducibility Challenge, jointly organized by the Reproducible Research and Quantitative MR ISMRM study groups, led to the creation of a large open database of standard quantitative MR phantom and human brain inversion recovery T1 maps. These maps were measured using independently implemented imaging protocols on MRI scanners from three different manufacturers. All collected data, processing pipeline code, computational environment files, and analysis scripts were shared with the goal of promoting reproducible research practices, and an interactive dashboard was developed to broaden the accessibility and engagement of the resulting datasets (https://
Acknowledgments
The conception of this collaborative reproducibility challenge originated from discussions with experts, including Paul Tofts, Joëlle Barral, and Ilana Leppert, who provided valuable insights. Additionally, Kathryn Keenan, Zydrunas Gimbutas, and Andrew Dienstfrey from NIST provided their code to generate the ROI template for the ISMRM/NIST phantom. Dylan Roskams-Edris and Gabriel Pelletier from the Tanenbaum Open Science Institute (TOSI) offered valuable insights and guidance related to data ethics and data sharing in the context of this international multi-center conference challenge. The 2020 RRSG study group committee members who launched the challenge, Martin Uecker, Florian Knoll, Nikola Stikov, Maria Eugenia Caligiuri, and Daniel Gallichan, as well as the 2020 qMRSG committee members, Kathryn Keenan, Diego Hernando, Xavier Golay, Annie Yuxin Zhang, and Jeff Gunter, also played an essential role in making this challenge possible. Finally, we extend our thanks to all the volunteers and individuals who helped with the scanning at each imaging site.
+++
5Data availability statement
An interactive preprint of this manuscript is available at http://9d7eff1). Note that accepted submissions are closed issues, and that the GitHub branches associated with the issue numbers contain the Dockerfile and Jupyter Notebook scripts that reproduce these preliminary quality assurance results and can be run in a browser using MyBinder. The ROI registration scripts for the phantoms and T1 fitting pipeline to process all datasets are hosted in this GitHub repository, https://8d38644), which also contains a Dockerfile to reproduce the environment using a tool like MyBinder. A dashboard was developed to explore the datasets information and results in a browser, which is accessible here, https://6ee9321).
6References
The T1 values vs temperature tables reported by the phantom manufacturer did not always exhibit a linear relationship. We explored the use of spline fitting on the original data and quadratic fitting on the log-log representation of the data, Both methods yielded good results, and we opted to use the latter in our analyses. The code is found here, and a Jupyter Notebook used in temperature interpolation development is here.
Interactive dashboard: https://
rrsg2020 .db .neurolibre .org, code repository: https:// github .com /rrsg2020 /rrsg2020 -dashboard The hierarchical shift function compares distributions throughout their range across multiple dependent measurements. More information can be found in this article, Wilcox & Rousselet, 2023, and in this blog post.
Strictly speaking, not all manufacturers operate a 3.0 T. Even though this is the field strength advertised by the system manufacturers, there is some deviation in actual field strength between vendors. The actual center frequencies are typically reported in the DICOM files, and these were shared for most datasets and are available in our OSF.io repository (https://
osf .io /ywc9g/). From these datasets, the center frequencies imply participants that used GE and Philips scanners were at 3.0T ( ~127.7 MHz), whereas participants that used Siemens scanners were at 2.89T (~123.2 MHz). For simplicity, we will always refer to the field strength in this article as 3T.Only T1 maps measured using phantom version 1 were included in this inter-submission COV, as including both sets would have increased the COV due to the differences in reference T1 values. There were seven participants that used version 1, and six that used version 2.
Due to the noise-floor or artifacts.
See online dashboard https://
rrsg2020 .dashboards .neurolibre .org /apps /stats and click on the “HSF” tab to view these graphs for all 14 spheres.
- Keenan, K. E., Biller, J. R., Delfino, J. G., Boss, M. A., Does, M. D., Evelhoch, J. L., Griswold, M. A., Gunter, J. L., Hinks, R. S., Hoffman, S. W., Kim, G., Lattanzi, R., Li, X., Marinelli, L., Metzger, G. J., Mukherjee, P., Nordstrom, R. J., Peskin, A. P., Perez, E., … Sullivan, D. C. (2019). Recommendations towards standards for quantitative MRI (qMRI) and outstanding needs. J. Magn. Reson. Imaging, 49(7), e26–e39. 10.1002/jmri.26598
- Fryback, D. G., & Thornbury, J. R. (1991). The efficacy of diagnostic imaging. Med. Decis. Making, 11(2), 88–94. 10.1177/0272989X9101100203
- Schweitzer, M. (2016). Stages of technical efficacy: Journal of Magnetic Resonance Imaging style. J. Magn. Reson. Imaging, 44(4), 781–782. 10.1002/jmri.25417
- Seiberlich, N., Gulani, V., Campbell, A., Sourbron, S., Doneva, M. I., Calamante, F., & Hu, H. H. (2020). Quantitative Magnetic Resonance Imaging. Academic Press.
- Damadian, R. (1971). Tumor detection by nuclear magnetic resonance. Science, 171(3976), 1151–1153. 10.1126/science.171.3976.1151
- Pykett, I. L., & Mansfield, P. (1978). A line scan image study of a tumorous rat leg by NMR. Phys. Med. Biol., 23(5), 961–967. 10.1097/00004728-197904000-00056
- Stikov, N., Boudreau, M., Levesque, I. R., Tardif, C. L., Barral, J. K., & Pike, G. B. (2015). On the accuracy of T1 mapping: Searching for common ground. Magnetic Resonance in Medicine, 73(2), 514–522. 10.1002/mrm.25135
- Boudreau, M., Keenan, K. E., & Stikov, N. (2020). Quantitative T1 and T1r Mapping. In Quantitative Magnetic Resonance Imaging (pp. 19–45). 10.1016/b978-0-12-817057-1.00004-4
- Bottomley, P. A., Foster, T. H., Argersinger, R. E., & Pfeifer, L. M. (1984). A review of normal tissue hydrogen NMR relaxation times and relaxation mechanisms from 1-100 MHz: dependence on tissue type, NMR frequency, temperature, species, excision, and age. Med. Phys., 11(4), 425–448. 10.1118/1.595535
- Dieringer, M. A., Deimling, M., Santoro, D., Wuerfel, J., Madai, V. I., Sobesky, J., von Knobelsdorff-Brenkenhoff, F., Schulz-Menger, J., & Niendorf, T. (2014). Rapid parametric mapping of the longitudinal relaxation time T1 using two-dimensional variable flip angle magnetic resonance imaging at 1.5 Tesla, 3 Tesla, and 7 Tesla. PLoS One, 9(3), e91318. 10.1371/journal.pone.0091318
- Wansapura, J. P., Holland, S. K., Dunn, R. S., & Ball, W. S., Jr. (1999). NMR relaxation times in the human brain at 3.0 tesla. J. Magn. Reson. Imaging, 9(4), 531–538. https://doi.org/10.1002/(SICI)1522-2586(199904)9:4<;531::AID-JMRI4>3.0.CO;2-L
- Ernst, R. R., & Anderson, W. A. (1966). Application of Fourier Transform Spectroscopy to Magnetic Resonance. Rev. Sci. Instrum., 37(1), 93–102. 10.1063/1.1719961
- Redpath, T. W., & Smith, F. W. (1994). Technical note: use of a double inversion recovery pulse sequence to image selectively grey or white brain matter. Br. J. Radiol., 67(804), 1258–1263. 10.1259/0007-1285-67-804-1258
- Tofts, P. S. (1997). Modeling tracer kinetics in dynamic Gd-DTPA MR imaging. J. Magn. Reson. Imaging, 7(1), 91–101. 10.1002/jmri.1880070113
- Sled, J. G., & Pike, G. B. (2001). Quantitative imaging of magnetization transfer exchange and relaxation properties in vivo using MRI. Magn. Reson. Med., 46(5), 923–931. 10.1002/mrm.1278