Supplementary
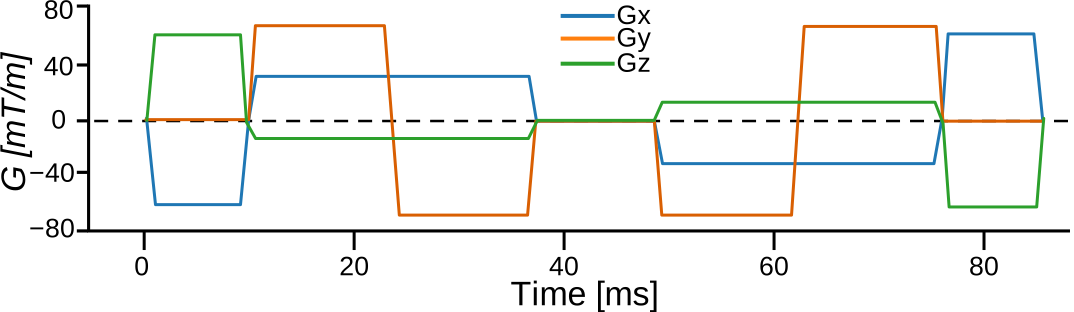
Figure S.1:Schematic of the spherical tensor encoding waveform used in this study. Linear tensor encoding acquisitions used a standard pulsed gradient spin echo sequence.
Figure S.2:Regression lines of the Mahalanobis distance (MhD) as a function of age for each group. The MhD tends to increase with age in most ROIs for AD and FTD, while trends in the small LBD group are inconsistent.
Table S.1:ANCOVA results for the log-transformed Mahalanobis distance
ANCOVA results comparing the four groups on the log-transformed Mahalanobis distance (MhD) for each ROI, controlling for age and sex. F statistic with its residual degrees of freedom (df_err), partial omega squared () with the lower bound of its 95% confidence interval, and p-values corrected for multiple comparisons with the Benjamini–Yekutieli false discovery rate procedure (p_adj).
Table S.2:ANCOVA assumption violations
ROI-metric combinations that did not meet the ANCOVA assumptions (before FDR correction). When homogeneity of regression slopes was violated, we refit the ANCOVA model with the interaction between group and the violating covariate. We visually inspected the cases that violated residual normality and kept them in the analysis. We also kept the case that violated homogeneity of variance, as group sizes were approximately balanced (10 to 14 participants per group).
Table S.3:Post-hoc pairwise group comparisons
Exploratory post-hoc pairwise group comparisons for the ROI-metric combinations that survived FDR correction in the ANCOVA, based on age- and sex-adjusted estimated marginal means from the ANCOVA models. t statistic with its residual degrees of freedom (df_err), partial Hedges’ g with its 95% confidence interval, and p-values Holm-corrected within each family of six contrasts. Only contrasts with Holm-corrected p < 0.05 are shown.
Figure S.3:Box plots of the metrics for the whole hippocampus, sampled in the HippUnfold surface space, for each group. Each participant contributes one value: the mean of each metric over the six subfields and both hemispheres, and, for volume, the summed volume of the six subfields in both hemispheres (% of TIV).
Figure S.4:Regression lines of the whole-hippocampus metrics from HippUnfold as a function of age for each group. The metrics follow the expected aging trends, with apparently different trends in participants with dementia.
Figure S.5:Line plots of the HippUnfold surface-based metrics (thickness, curvature and gyrification) across the hippocampal subfields for each group. The solid line represents the mean, and the shaded region denotes the 95% confidence interval of the mean (mean ± 1.96 × standard error), computed over both hemispheres of all participants in each group.